 Traid
TraidCharts, local strategy execution, quantitative studies and a persistent research conversation.
Available in the browser Traid / Research systemsMarket research;
Market research;
with the workings.
Bring market context, quantitative models and strategy evaluation into one workspace. Inspect the assumptions; follow a result back to its data and code.
// Daily data → strategy → evidence
import { parseCSV, runBacktest }
  from './engine.js';

const bars = parseCSV(csvText);
const result = runBacktest(bars, {
  fast: 20,
  slow: 50,
  capital: 10000,
  costBps: 10
});

console.log(result.trades);
News, native chart notebooks, research models and a local paper ledger.
Native app in developmentA physical extension of the same visual language; explored through an original 3D hardware scene.
Hardware research · future directionResearch workflowFrom a question
From a question
to an inspectable result.
A useful research environment preserves context. The headline, chart, assumptions and calculation should remain close enough to challenge one another.
Read the market context.
AI News supplies article imagery, source links and dated market metrics. Keep charts and news side by side; send a headline to the research conversation.
Open business news ↗Make the idea explicit.
Import daily OHLCV, inspect an indicator, or configure the moving-average baseline. The Code view exposes parameters, the execution module and the latest result.
Open the strategy workspace ↗Retain the evidence.
Compare equity and drawdown, inspect every fill, and export the result with its dataset fingerprint. Walk-forward studies keep training and later evaluation periods distinct.
Read the evaluation note ↗Quantitative workspacesThe mathematics
The mathematics
is part of the interface.
Change an assumption and inspect its effect on the plot. The current studies run locally; their equations, conventions and source references remain visible.
Realised volatility
↗σ̂ = √[ (252 / n) Σ r²ᵢ ]
Annualised RMS log returns, a rolling window and the return distribution. Distinguish realised variation from an implied volatility quote.
Momentum & mean reversion
↗mₜ = Pₜ / Pₜ₋ₖ − 1 · zₜ = (Pₜ − μ̂ₜ) / σ̂ₜ
Lookback return and standardised deviation; two descriptions of price behaviour, each with a different hypothesis to test.
Statistical arbitrage
↗sₜ = log Pᴬₜ − α̂ − β̂ log Pᴮₜ
Estimate a hedge relationship and inspect the residual spread. Correlation and a fitted spread alone do not establish cointegration or a tradable edge.
Options & sensitivities
↗Δ = ∂V / ∂S · Γ = ∂²V / ∂S²
European Black–Scholes sensitivities across spot and expiry. Rotate the surfaces; examine Delta, Gamma, Theta and Charm under explicit inputs.
Probability & distributions
↗P(A | B) = P(B | A) P(A) / P(B)
Conditional price distributions, tail probabilities, Bayesian updates and a return/risk bubble map. Model assumptions stay beside the result.
Model evaluation
↗β̂ = (XᵀX + λI)⁻¹ Xᵀy
A ridge-regression baseline with a chronological holdout, alongside a strategy parameter surface. Inspect predictive error and selection sensitivity before adding complexity.
Engineering / Backtest contractKnow what
Know what
the calculation assumes.
The first engine is deliberately narrow: a long-or-cash moving-average crossover on daily bars. Its value is that the timing, costs and arithmetic can be checked independently.
- Input
- One daily series; time, open, high, low, close and volume. Dates must be unique and ordered.
- Signal
- Fast SMA above slow SMA; only closes available before the execution bar enter the signal.
- Execution
- Next open. Fractional units, no leverage; costs on both entry and exit. Remaining positions close at the final bar.
- Benchmark
- Buy and hold with the same warm-up, initial capital and transaction-cost rate.
- Output
- Equity, drawdown, Sharpe, completed trades and costs; export includes engine version and SHA-256 dataset fingerprint.
Default charts use generated research series. CSV data stays in your browser. The current model does not simulate market impact, borrowing, taxes or account-specific prop-firm rules.
{
  "fast": 20,
  "slow": 50,
  "capital": 10000,
  "costBps": 10
}Native companion / SwiftUIThe same research language.
The same research language.
Designed for the phone.
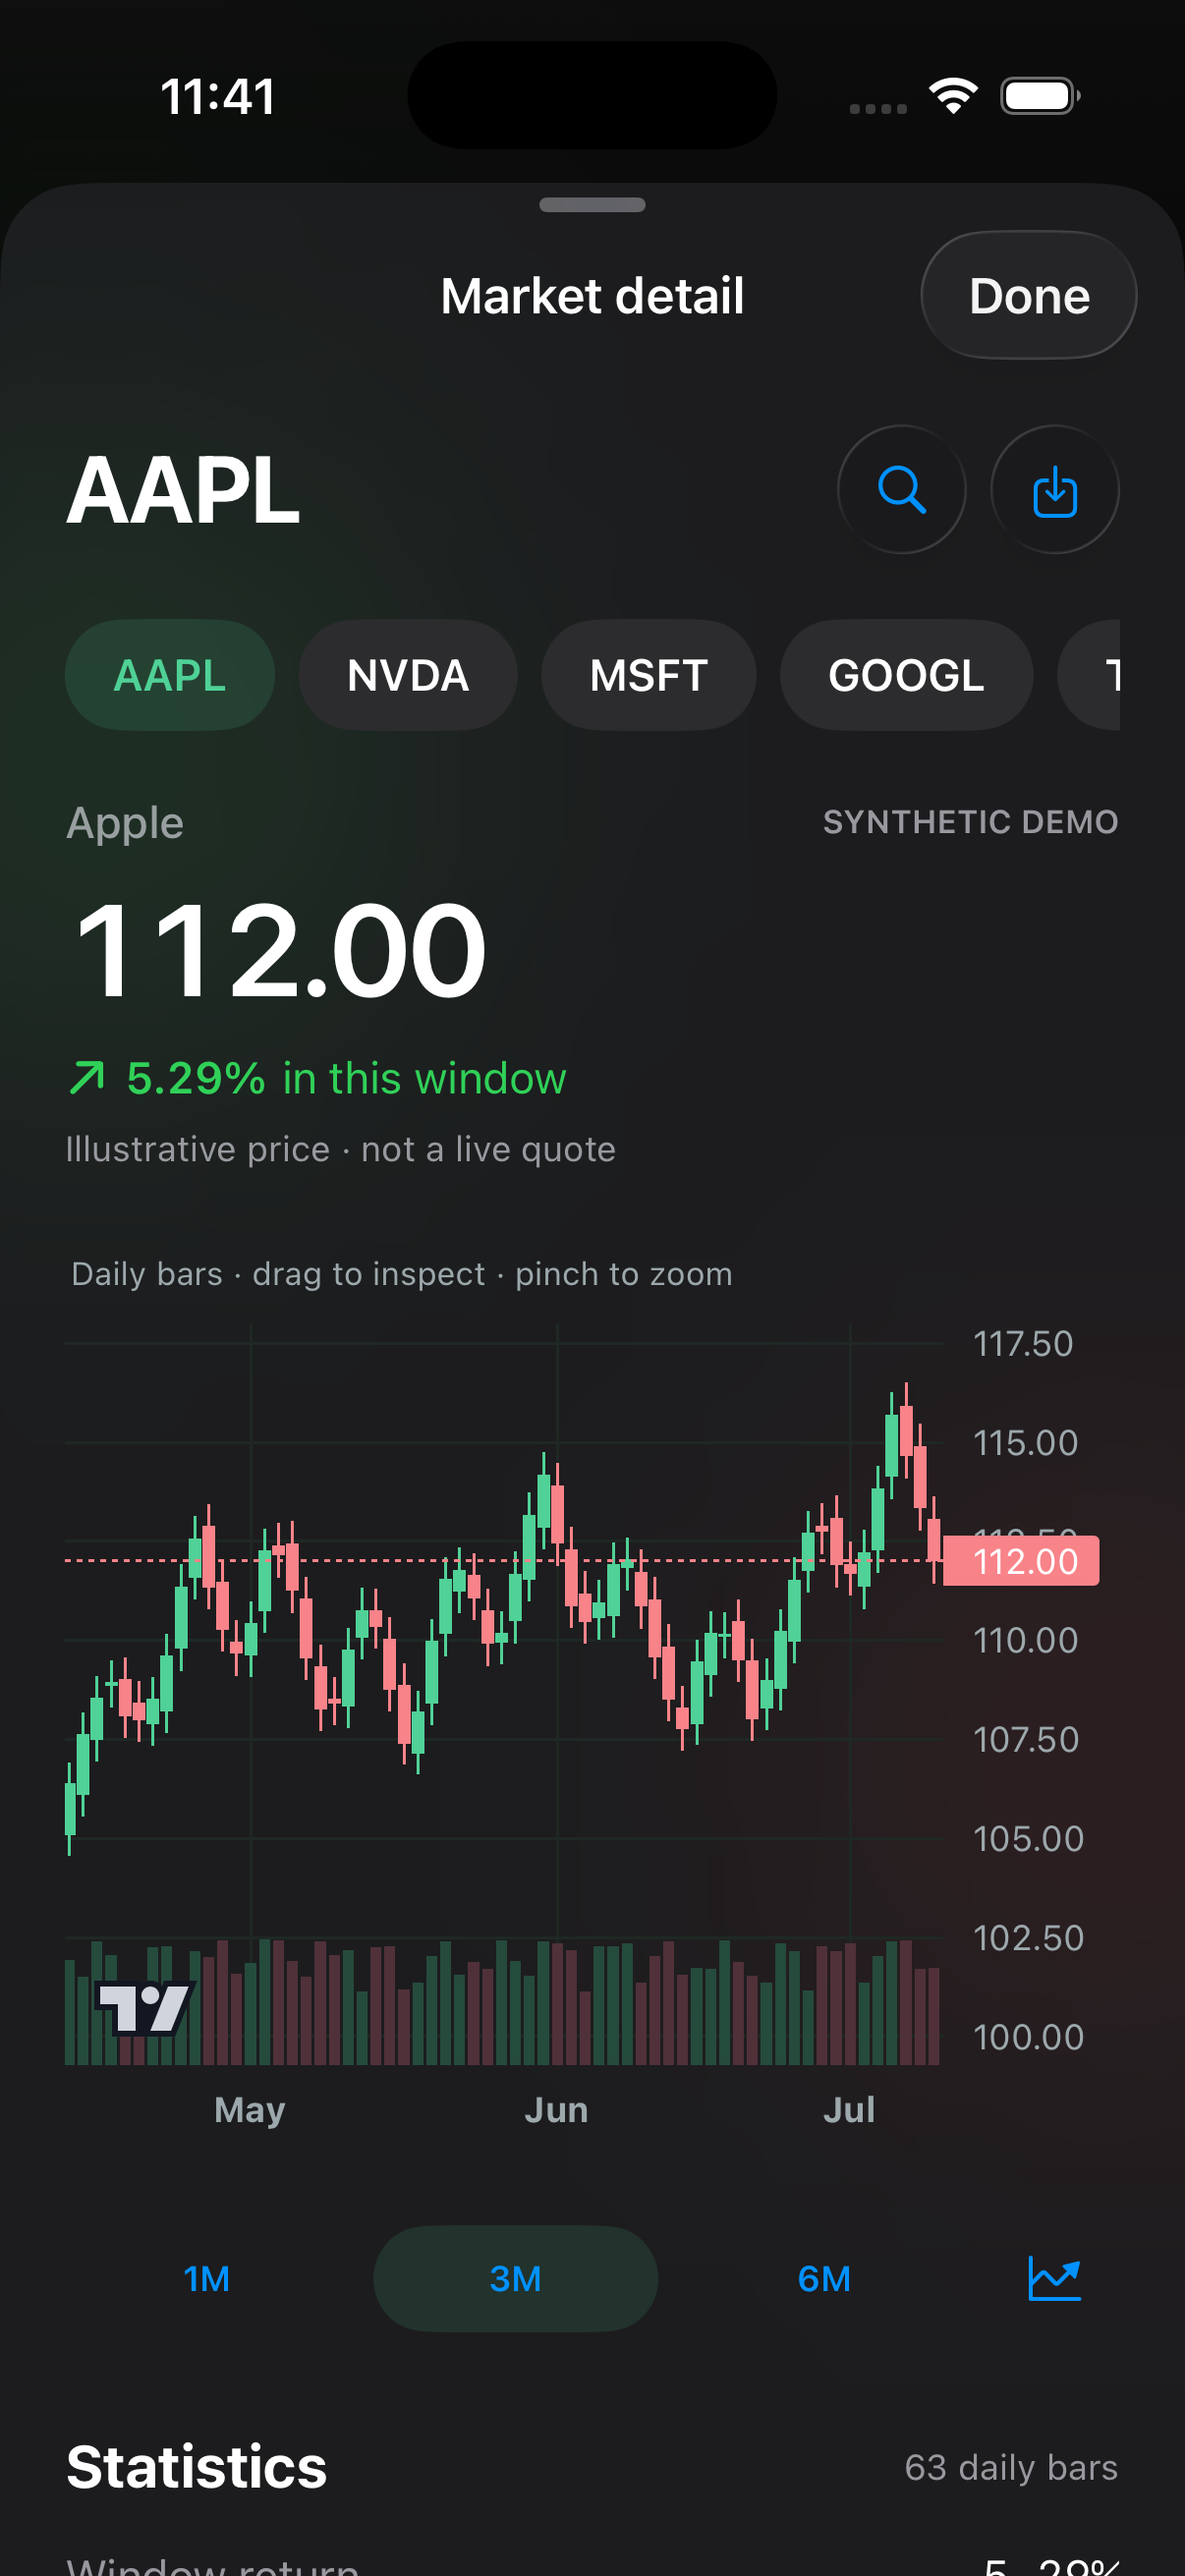
The iOS app retains Traid’s original full-screen news and conversation experience. Chart notebooks, horizontal model cards and quantitative sheets add depth without losing that foundation.
- Market context
- Article photography and the same AI News service used by Terminal.
- Research tools
- Chart overlays, options, volatility, correlations, probability and position-sizing calculations.
- Local records
- Historical paper fills and research conversations stored on the device. Cross-device account sync remains a separate integration.
In development for iOS. App Store distribution is not yet available.
Traid Research
Questions behind the build.
Short research notes connect the product to the underlying literature; with as much attention to limitations as to potential applications.
An opinion is cheap; a record is harder. ↗Backtest overfitting, confidence calibration and the case for preserving unsuccessful experiments.How does information become a price? ↗News diffusion, prediction-market resolution and the difference between a quoted gap and an executable one.The distribution inside the option price. ↗Breeden–Litzenberger; numerical differentiation, noisy strikes and the risk-neutral measure.Where the model lives matters. ↗Truffle, private compute, reproducibility and the limits of prediction through the Rehoboam lens.
Development directionWhat comes next;
What comes next;
and what it requires.
The current tools establish a research workflow. Connected execution, verified strategy records and model distribution need their own data contracts and evaluation.
Agent workflows, model records and strategy access
Connect a source-linked thesis to a model version, forecast horizon and confidence recorded before resolution. Evaluate calibration, Brier score, drawdown and abstention over time. Fine-tuning, shared records, leased research models and copy execution are future work; reputation should follow prospective evidence.
Prediction markets, information diffusion and wallet tracking
Polymarket, Kalshi, X and wallet tracking are intended integrations. A mispricing study must retain first-observable timestamps, market resolution wording, fees and liquidity; a disagreement between two quoted probabilities is not sufficient evidence of arbitrage.
Portfolio risk, volatility and prop-firm constraints
Extend the local paper ledger with fresh quotes, position-level risk and configurable loss limits. Add licensed option-chain data for term structure, implied distributions, correlation and expiry studies. Prop-firm evaluations require explicit daily-loss and drawdown rules; passing or receiving payouts remains an outcome to measure.
Local compute and reproducible machine learning
Compare local inference and hosted agents on the same research tasks: provenance, privacy, latency and cost. Truffle is a hardware reference; Qlib, GS Quant and the wider open-source ecosystem inform the engineering plan. They are not all installed services in the current product.
The research shelf / Primary literatureFollow the idea.
11 papersFollow the idea.
Read the original.
The mathematics has a history. These are the papers behind the questions we are asking; each entry connects the original work to a calculation, a limitation or a next experiment in Traid.
Alongside the papers / Software & systems
The research stack has its own sources. Plotly.js and Lightweight Charts power the current charts; the wider libraries and local-compute ideas are assessed in our engineering notes.
Traid Pay / Hardware research
An original physical design.
A MagSafe wallet concept carrying Traid’s traffic-light identity. This is the original interactive 3D scene; the hardware and payment service remain future projects.
Loading the original 3D scene…
01 / FormOriginal Traid 3D scene